
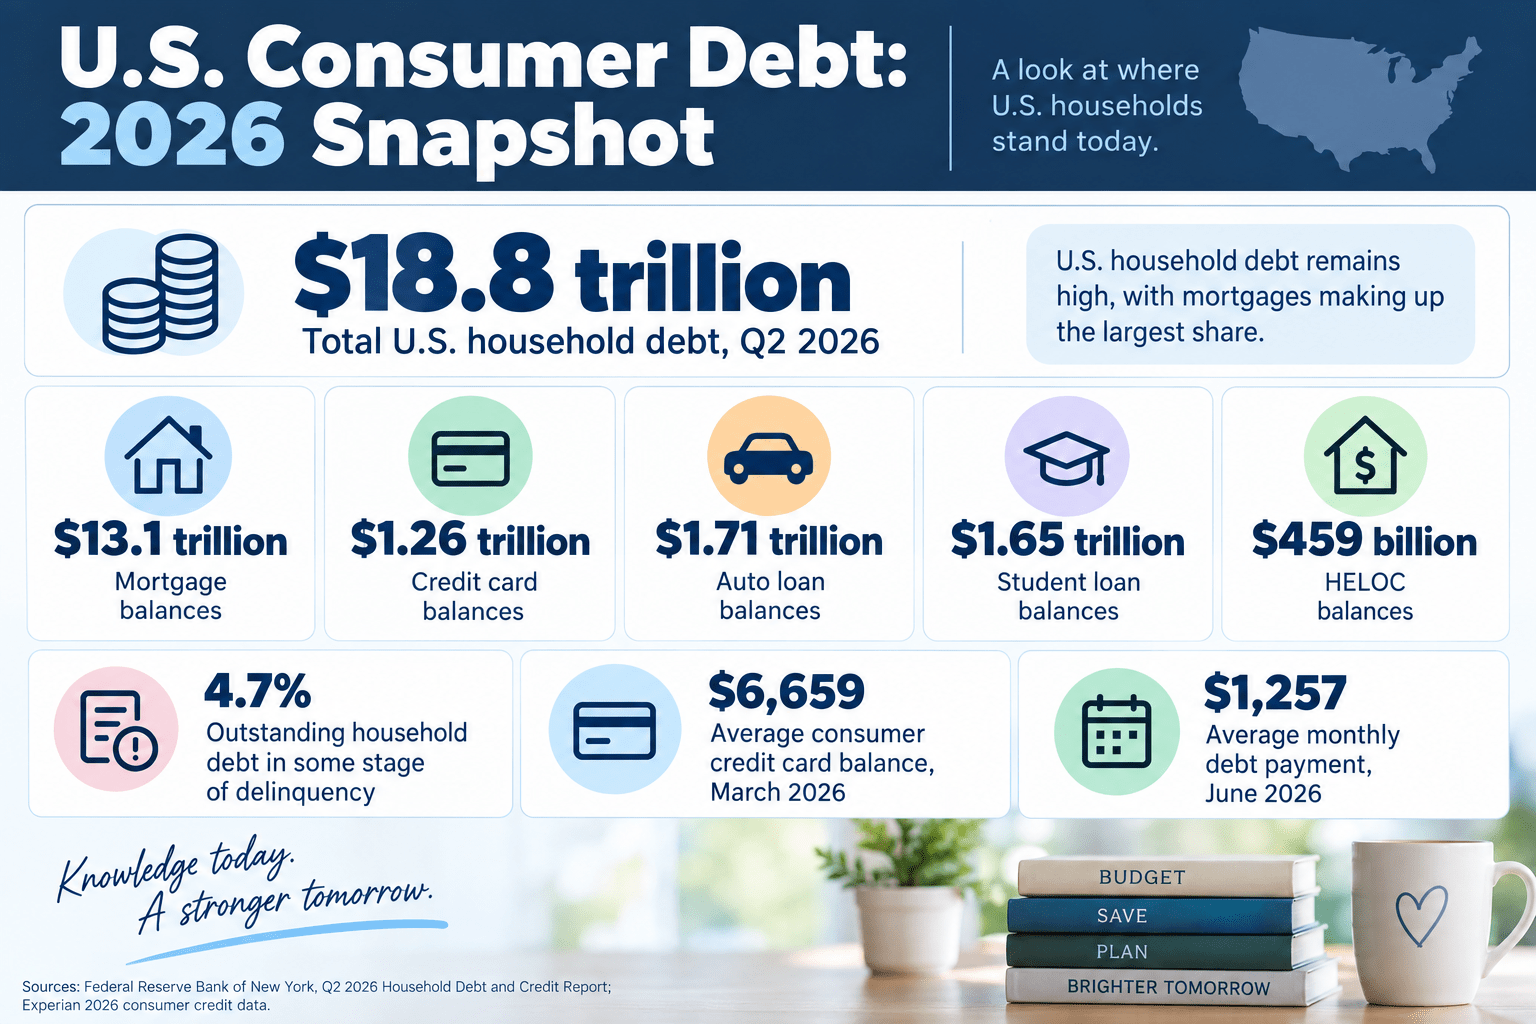
When we first published our consumer debt infographic in 2013, American households were already carrying a substantial amount of debt. More than a decade later, the numbers have changed dramatically. As of the second quarter of 2026, total U.S. household debt stands at approximately $18.8 trillion, according to the Federal Reserve Bank of New York. […]
Continue ReadingTag: infographic
Surprising Water Usage Numbers [Infographic]
How much water are you really using? Many of us have low flow shower heads and our toilets are using less water, but how does that compare to the water that goes into the things we use and consume every day? You can also save money each year by trying to save water. Your water […]
Continue Reading